When Hershey's Asks for Your Help

Saturday, June 2, 2018 No comments
After meeting and reflecting over our first PBL, "Becoming a Financially Responsible Citizen," our 7th grade team began brainstorming and creating a PBL, where learners would be given the challenge of creating a new 3D candy and wrapper.

Google Forms came to our rescue once again as we determined our design teams!  Learners were asked about their most favorite and least favorite types of candy, which of course sparked interest in why we needed this data.  Soon groups were created and the challenge was accepted!
Forms response chart. Question title: What is your #1 choice in candy? . Number of responses: 96 responses.

Based on our reflection of the previous PBL, we decided that we needed to make a few changes on how we kicked off!  On day 1, we gave each learner  the entry document, which was a letter from the CEO of Hershey's, Volume & Surface Area Checkpoint of what the project entailed as well as a copy of our Unpacking the Standards document.


As students read through the letter, they annotated the documents and began to create their Knows & Needs to Know Charts.  Because we included more details about what was going to be required as far as designing and creating both a 3D model of their new candy and wrapper, writing a persuasive letter,  they had  specific questions for our class charts!


After creating our Knows and Needs to Know, we dove into discovering the volumes of various 3-dimensional figures.  The twist came when we used composite figures in our Willy Wonka workstations.  We created 25 scenarios and included QR codes, so learners could quickly check their work to see if they were on the path of success!


During this learning opportunity, students had to determine the type of 3D figure and write the correct formula.  We focused on triangular prisms, pyramids and threw in a few challenge problems with spheres and cones!

One of the standards that our PAP students had to cover was determining the relationship between the volume of a cone and a prism.  This is one of my favorite lessons to teach during this unit!  Learners used Flipgrid to explain how they determined the relationship between the volume of the cone and prism.  


As we finished our Willy Wonka Workstations, students began to create their 3D models, using Tinkercad.  Tinkercad is a web-based program that allows you to create 3D models and eventually print on a 3D printer.


One of our goals was to be intentional with allowing time for students to use the program prior to when we actually needed it in class.  During the month of February, each 7th grade teacher posted the directions on how to use Tinkercad, as well as digital files for additional resources.


To ensure we knew what our Falcons would be experiencing, we also created items in Tinkercad and then used our 3D Poly Printer to create objects.  It's so important to understand where our learners are and how it feels to be in their shoes, during a new learning opportunity!


Students used the days leading up to spring break to create their 3D candy models and loved being able to actually print it on our 3D printers!  Of course we had a few curve balls thrown at as as far as the dimensions but we all figured it out and models were created.


After spring break, it was time for our learners to focus on designing their wrapper for their new candy.  In order to help them learn about all of the details that go into packaging, we reached out to a local company Virtual Packaging.  Jordan Patterson, Director of Admissions, and Tara, the VP of Sales, came and spoke with our Falcons.    Jordan and Tara did a great job on keeping our kids engaged as they shared graphs about how one's age determines the type of candy they prefer.  Did you know that those older than 35 prefer chocolate over sour?  It's not too shocking considering how much our middle schoolers love sour candy!  Our Falcons also learned about various packaging materials that are used.  Information learned from this presentation was used in several students persuasive letters and commercials!  

To build on our experience of Willy Wonka's candy factory, we created more workstations that focused on the wrappers of Willy Wonka's candy products, in another gallery walk!  Because of the confidence and success of our Falcons, we were able to move faster through this activity which allowed for critical friends to be implemented (another goal from our last PBL!)

We reached out to our speech teacher and asked if her 8th graders would want to serve as critical friends and offer advice on our Falcons' presentations.

Another new idea that we implemented was having our Falcons write persuasive letters.  We reached out to our 7th grade ELA teachers, who jumped on board with helping us!  This was a huge learning opportunity for everyone as this was the first cross curricular lesson we had done, as well as making it digital.  The kids felt extremely "grown up" and loved being able to tell the judges why their candy should be chosen!  


Student Presentations:


Becoming Financially Responsible Citizens


This year was full of many learning opportunities for my fellow teachers as we implemented more inquiry based learning opportunities for our students.  During June 2017, our math and science departments spent 4 days together, learning about project-based learning, as part of our STEM certification.  Our 7th grade teachers created a mini PBL on simple and compound interest, which became the skeleton for our PBL that would encompass two of our units:  Percents & Percent Applications and Personal Financial Literacy.  I loved the excitement of my fellow teachers as we created meaningful lessons for each day, the reflection that occurred as to how we could improve our instruction to better meet the needs of our learners and most of all the excitement that our 7th graders were having in our math classrooms!


About 10 weeks into our school year, our 7th graders were given the following driving question:  “Based on the current financial trends, how can I create a financial portfolio that will allow me to be a financially responsible citizen?”  

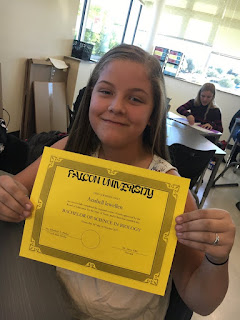
Prior to our kick off, learners were given a survey, using Google forms, where each learner chose their top 3 STEM careers.  We used this data to help create our groups!    Students were curious why they had to complete this survey and on Monday, October 16, they each graduated from Falcon University with a bachelors degree.  Our academic coach, Mary Terry, arrived in our classrooms, with a special delivery...their college degrees!  The ceremony wouldn't have been complete without pomp and circumstance playing and shaking each of our graduates' hands.  


Upon our graduation ceremony, our learners were given the standards that we would be covering during the course of the next two weeks.  Individually, learners annotated their page, creating their individual Knows & Needs to Know chart. We progressed to making a class Knows & Needs to Know chart through scaffolded questioning.  

 
As a 7th grade PLC, we loved how this chart guided our daily instruction and how enthusiastic our Falcons were when it came to moving items from the Needs to Know side to the Knows side.  Learners were truly owning their learning!  


As part of their first day of life beyond college, learners were given the challenge of creating their financial portfolio, which was a pocket folder, where all of our learning would be documented!  After their first "day" of work, each learner was paid.  Learners quickly realized that a large percent of their earnings were taken away to cover health insurance, savings and taxes.  


Learners used the strategy WOCN to determine how much money was allocated to healthcare, savings and taxes.  

This was a Google Slide from one group's PSA that explained how to use WOCN when working with percents.

After spending several days working with percents, our learners were asked to help find a solution to the increasing numbers of those who can't afford to make their car payment!  On Tuesday, October 24, Mr. Fichter, General Manager of 5 Star Ford, came to speak with our Falcons.  


Our Falcons were amazed at how much a $50,000 F-150 actually cost!  Mr. Fichter brought actual finance documents and learners analyzed them.  


As we continued throughout the month of October. learners were given various opportunities to apply their knowledge of percents to budgeting and purchasing a car!  We were fortunate that one of our 7th grade teachers is married to a car manager at an area car dealer, so he shared his current inventory with us.  Based on this data, we created several learning opportunities for our Falcons.  The first real world application was a gallery walk called "Walk the Lot."  This activity focused on the interest charged on various car loans.  


Here is a sample problem from Walk the Lot:  

You have decided to purchase a black 2016 Cadillac Escalade with 24,899 miles.  The purchase price is $66,742. If you finance the entire amount at a simple interest rate of 6% for 5 years, how much interest will you pay?  What will be the total amount you pay for the Escalade?

Our learners also discovered which monetary incentives were the best for them, based on their knowledge of their net pay and interest on loans.  


As we grew closer to determining a financial solution to alleviating debt, learners were allowed to "Supe Their Ride," a spin off of the reality tv show!  They were given the option of upgrading the sound system, adding rims, having leather or cloth seats, just to name a few.  This gallery walk allowed learners to continue working with tax, commission and discounts in various situations.  They absolutely loved designing their vehicle, but quickly learned priorities needed to be made when making such an important financial decisions!

As we moved into November and our Falcons had experienced several learning opportunities involving percent application, they were let loose to create their financial PSA, based on the task given to them by Mr. Fichter!  Some utilized Google Slides, while others stepped out of their comfort zone and used the green screen room in our learning commons.  We loved watching them beam with pride as they created and shared their PSAs with their classmates!  


After we completed our first PBL, as a 7th grade team, we gave a survey, using Google Forms, to both our Falcons and their parents.  Below are some of the results we received:  

Forms response chart. Question title: After spending the past 3 weeks learning about percents and financial literacy, what was your least favorite activity?  (Choose only 1!). Number of responses: 53 responses.

Forms response chart. Question title: Did you enjoy this unit and how your learned compared to our other units?  . Number of responses: 53 responses.Some of the comments students shared included:  

  • we got to make a movie/slide show
  • how we work in groups
  • picking our car that fits best into the budget
  • Thank you for making math fun!  
  • Having a guest speaker in math was cool.
From the survey we gave to our parents, we received this feedback:  


Google Form Survey sent to our Falcon parents


The three top lessons, that sparked the most conversation at home, were:  

Day 2:  My First Paycheck
Day 4:  Fixed vs. Variable Expenses
Day 7:  Mr. Fichter speaks at NRMS


In January 2018, we met with our district math coordinator to reflect on our first PBL.  Based on the rubric provided from NISE, we drew the following conclusions:


Standards/TEKS

  • We need to spend less time on Compound interest. We can use technology to interactively demonstrate the difference between simple and compound interest. We all agreed that we should use the WON strategy when we begin our unit of proportions, rather than wait until we begin percents.  

Driving Question & Entry Document
  • Our question needs to be more open ended and broader. We need to give our entry document (letter from 5 Star Ford) earlier, so students have time to process the task and be prepared to ask questions!  

Technology Integration
  • We would like to start the digital presentations earlier, which would entail before or after school opportunities. To integrate technology throughout our PBL, we would like to add a digital choice board of activities that encourages learners to create various artifacts and allows them to use other digital tools. We also thought we could have students do more research as far as pricing of vehicles, rather than just give them the information. Another extension included utilizing Google Sheets to show how formulas are used and graphs can be created!  
  • We need to provide tutorials for our learners about the technology we'd like for them to utilize. We'd like to include a webquest next year to enhance our students' learning

Culminating Product
  • Due to the number of students who used Google Slides, we'd like to encourage other presentation options. In order to allow enough time with technology, we as teachers agreed that we need to open up the computer lab or maker space before and after school. We also thought about having the students present in class and be recorded, which could be displayed elsewhere.  

Overall the 3.5 weeks of learning that took place during the fall of 2017 were worth the hours of planning and reflecting! I'm proud to work with a team of educators who stepped out of their comfort zone and put their heart and soul into making this experience so meaningful for our Falcons! We new we were moving in the right direction, as a 7th grade team, when our CBA data came back and showed growth is the standards are PBL covered. It was just the motivation we needed, as we began planning our next PBL, which was implemented in March!